
Mrunal Bhagat is Retail Media Lead at Pearson. In this opinion article, she explains the limitations of ROAS as a measurement approach in the “recommendation economy” – and why she has created a model that lets businesses truly understand where to allocate spend.
It’s Monday morning at 9:00am. The Commercial Growth meeting commences by analysing a dashboard comparing ROAS performance across ad types, audiences and retail partners.
Sponsored Products are delivering a 10X ROAS. Display is at 4X. Video sits at 3X.
The decision is immediate and familiar: “Sponsored Products are clearly our best-performing investment. Let’s move more budget there.”
It’s a perfectly logical conclusion. It just happens to be based on an incomplete view of the customer journey. Because ROAS tells us which media touchpoint received credit for the sale. It doesn’t tell us where the customer’s decision was made.
Increasingly, that decision happens somewhere else. Behind closed doors. Inside a ChatGPT or another large language model conversation your ads were never invited to.
By the time the customer clicks your Sponsored Product listing, the most important part of the journey may already be over. The sale wasn’t won at the click; the click simply recorded it.
That’s the distinction many boardrooms still haven’t made. Here’s why they need to urgently update their approach to measuring outcomes.
The limitations of ROAS in the recommendation economy
Twenty years ago, media was fragmented, just as it is today. What has changed is not fragmentation, but the mechanics of where and how consumers make decisions. ROAS was built for a world of linear, clickable paths.
In today’s Large Language Model (LLM)-driven recommendation economy, that maths is fundamentally broken. Post the advent of generative AI, ROAS is still doing what it was designed to do, but marketers are asking it to answer questions it was never built to handle.
- It is limited to the last touchpoint: ROAS cannot distinguish between demand your advertising created and demand it simply captured. If a consumer asks ChatGPT for a product recommendation and later clicks an Amazon ad to buy it, your ad console claims 100% of the credit. The ad didn’t persuade them; the AI conversation did.
- It looks backward, not forward: ROAS is a lagging indicator. It reports a past outcome rather than predicting a future direction. It cannot warn you if your discoverability inside LLMs is quietly eroding or if consumers are choosing competitors before ever reaching your website.
- It reduces growth to a basic spend-to-revenue equation: ROAS measures short-term media efficiency, not long-term business growth. It completely ignores customer lifetime value, market share gains, and whether you are becoming the brand that AI algorithms trust and recommend.
The question for leadership is no longer how to improve ROAS; it’s how to find the metrics that measure future demand.
If ROAS has so many limitations, why is the industry still obsessed with it?
If senior marketers understand these flaws, why does ROAS still dominate the boardroom? The answer isn’t ignorance. ROAS solves critical corporate problems remarkably well – even if it fails to solve the marketing ones.
- It offers unmatched simplicity: In a world of complex data, ROAS provides a single, universally understood fraction. For every £1 spent, how much revenue did we return? It is simple enough to explain to a busy CFO in under thirty seconds.
- It feeds short-term reporting cycles: Businesses run on monthly trading updates and quarterly board reviews. ROAS fits this corporate rhythm perfectly. It responds instantly to campaign tweaks, whereas incrementality and market share shifts take months to mature.
- It reduces executive anxiety: Boardrooms crave objective certainty. ROAS provides a clean, comforting number that allows leadership to easily compare campaigns, agencies, and channels across a unified language.
- Corporate structures are naturally risk-averse: Agency contracts, bonus incentives, and board expectations are hardcoded around this single metric. Overhauling it requires changing how a business defines success.
The mistake is not using ROAS, per se; the mistake is using a media efficiency metric as your primary compass for business growth.
That is why I created the ‘Trojan Horse’ model. It’s called this because the model respects the boardroom’s desire for ROAS – but opens up to reveal the hidden metrics required to win.
ROAS gets your horse through the gate, but it cannot take the city.
The Trojan Horse Model
The Trojan Horse Model derives its name from one of history’s most famous victories – and its logic from the same playbook. The Greeks did not conquer Troy by attacking its walls head-on but by entering the city disguised as something familiar. Had Troy attempted to force open the horse before dragging it inside, history might look quite different.
This model attempts to fix that mistake, forcing one to look beyond the mere outer shell of ROAS. When one does, they find the three hidden soldier metrics that provide them with a directional path to commercial success:
Soldier metric 1: Customer value
Traditional commercial growth strategies start with ad execution. The Trojan Horse Model starts with the consumer. This informs brands of their true commercial headroom, directing exactly where and on whom capital needs to be spent.
There are various market intelligent platforms like NielsenIQ, Kantar, etc., that allow brands to look past basic demographics to filter top performing audience type at the category level.
For example; a brand selling coffee beans might look for:
- Premium Coffee Drinkers
- Avid Coffee Drinkers
- Occasional Coffee Drinkers
NielsenIQ shows the baseline category data: Audience 1 category revenue is £10M, out of which the brand’s share is £100K; Audience 2 category revenue is £700K, out of which the brand’s share is £20K, and audience 3 category revenue is £30K, out of which the brand’s share is £4K.
Here, brands must apply a customer wallet share formula:

Applying this formula to our example reveals the precise Share of Wallet for each group:
- Audience 1 SOW = 1%
- Audience 2 SOW = 3%
- Audience 3 SOW = 13%
Making Audience 1 your primary target and investing in reaching and converting them is where the commercial growth lies. This informs top management exactly where the war is worth fighting before allocating ad investment.
Furthermore, this analysis can be replicated at the retailer level. This occurs at a macro, generic category level bound to each retail partner without disclosing proprietary competitor data.
The objective remains clear: to map the target segment’s commercial headroom against the brand’s share. This should be done at a macro level as well as deeply within each retail partner ecosystem.
Soldier metric 2: Incrementality
Once Customer Value defines who to go after and where, the media execution piece comes into play. The incrementality metric tells if a brand’s campaign is driving net-new customers or simply claiming credit for existing sales.
To isolate real growth, brands must measure causation through Incremental Return on Ad Spend (iROAS), using the following formula:
Incremental Revenue = Ad-Exposed Revenue – ((Non-Ad-Exposed Revenue / Non-Ad-Exposed Size) x Ad-Exposed Size)
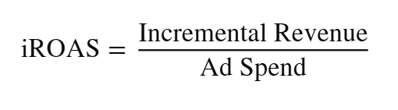
When the campaign concludes, brands run a normalised per-capita calculation to isolate these net-new sales. This metric strips away the illusion of standard ad console attribution and demands to know if the media actually forced a change in consumer purchasing habits, or if those sales would have happened anyway.
Soldier metric 3: Share of Model
Before a customer interacts with an ad or visits a website, they are increasingly entering a ‘recommendation economy’. This recommendation economy reflects a massive shift in consumer behaviour: asking Large Language Models like ChatGPT for direct product recommendations.
While there is currently no direct or accurate way to trace an LLM-influenced sale, Share of Model (SOM) can provide the foundational brick. It measures how often a brand appears, as well as how it is ranked, within LLM-generated answers.
This requires tracking two critical commercial metrics:
- Visibility Score: How often the brand or its products were included within a generative response.
- Average Position Rank: How high up the product is listed within those recommendations.
In the recommendation economy, if a model places your brand at rank number 3, you have already lost the sale before the customer journey even began. If a brand is placed at rank number 1, it wins the automated digital/LLM shelf.
Every query where a competitor appears and your brand does not must become an immediate part of your content strategy. This is because AI models are trained on high-quality content: content that leaves a permanent digital footprint – not advertisements. AI was never trained on ads. Therefore, a brand relying solely on ad investment will never be able to buy its way into LLM’s organic recommendation economy
While paid ads options like ChatGPT Ads are useful media lever, they will ultimately fail to acquire new customers or drive long-term commercial growth if your organic foundation is missing.
The Trojan Horse Model as a commercial diagnostic tool
The Trojan Horse Model is not a mere post-campaign reporting tool, but rather a pre-investment diagnostic framework, designed to change how leadership evaluates opportunity and deploys capital.
The three metrics do not replace ROAS; they sit inside it. ROAS remains the familiar, hollow outer shell, while Customer Value, Incrementality, and Share of Model provide the diagnostic intelligence underneath it. Together, they shift the question from “Which media investment delivered the highest ROAS?” to “Where is the commercial opportunity, and did the investment genuinely create an incremental growth?”
That is the Trojan Horse Model in practice. ROAS gets the strategy through the gate, but the metrics beyond it determine where the business goes next. Because the real question was never whether ROAS is enough. It was whether, in an AI-driven recommendation economy, we are measuring actual commercial growth or merely the last step of a journey that has already been decided.
Read more opinion from retail media experts on Retail Media Age.